|
chr2_-_158008763
|
1.083
|
NM_004288
|
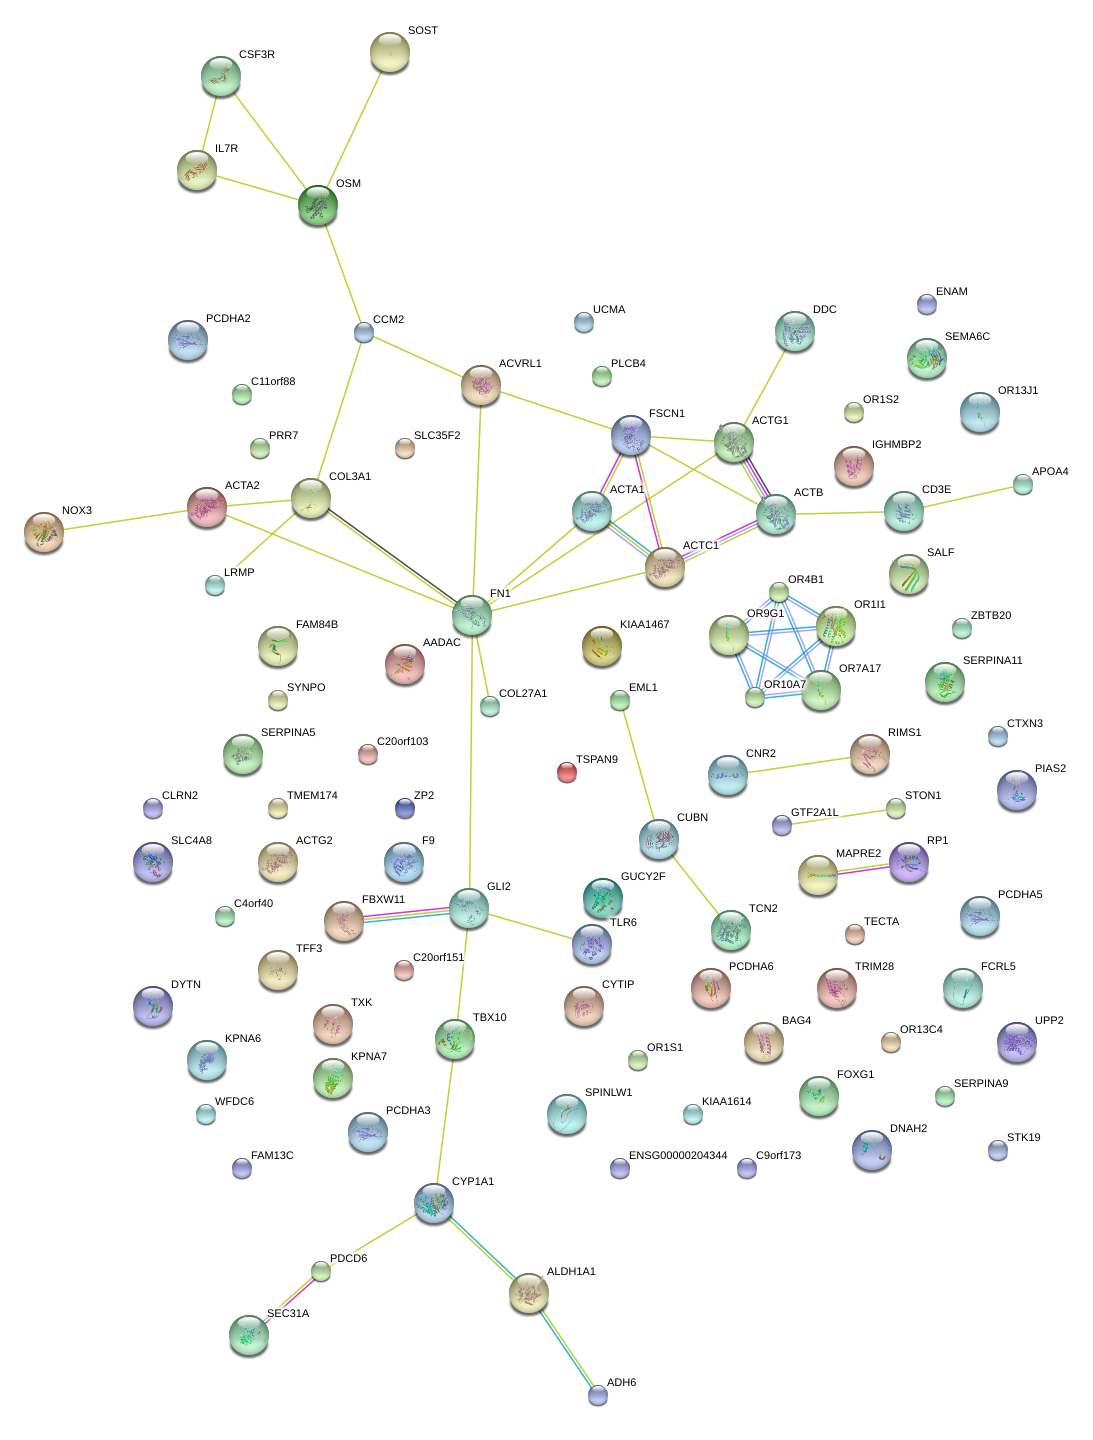
CYTIP
|
cytohesin 1 interacting protein
|
|
chr6_-_155818728
|
1.023
|
NM_015718
|
NOX3
|
NADPH oxidase 3
|
|
chr2_+_189547323
|
0.960
|
NM_000090
|
COL3A1
|
collagen, type III, alpha 1
|
|
chr2_+_189547358
|
0.877
|
|
COL3A1
|
collagen, type III, alpha 1
|
|
chr2_+_73973640
|
0.787
|
|
ACTG2
|
actin, gamma 2, smooth muscle, enteric
|
|
chr20_-_60435983
|
0.776
|
NM_080833
|
C20orf151
|
chromosome 20 open reading frame 151
|
|
chr2_-_207291364
|
0.750
|
NM_001093730
|
DYTN
|
dystrotelin
|
|
chr2_+_189547377
|
0.748
|
|
COL3A1
|
collagen, type III, alpha 1
|
|
chr2_+_73973600
|
0.669
|
NM_001615
|
ACTG2
|
actin, gamma 2, smooth muscle, enteric
|
|
chr14_+_28306633
|
0.571
|
|
FOXG1
|
forkhead box G1
|
|
chr10_-_13316333
|
0.539
|
NM_145314
|
UCMA
|
upper zone of growth plate and cartilage matrix associated
|
|
chr9_-_74735669
|
0.539
|
|
ALDH1A1
|
aldehyde dehydrogenase 1 family, member A1
|
|
chr4_+_71054492
|
0.512
|
NM_214711
|
C4orf40
|
chromosome 4 open reading frame 40
|
|
chr7_-_98643024
|
0.491
|
NM_001145715
|
KPNA7
|
karyopherin alpha 7 (importin alpha 8)
|
|
chr20_-_43609409
|
0.488
|
NM_001198986
NM_020398
|
SPINLW1-WFDC6
SPINLW1
|
SPINLW1-WFDC6 readthrough
serine peptidase inhibitor-like, with Kunitz and WAP domains 1 (eppin)
|
|
chr11_-_67163600
|
0.454
|
NM_005995
|
TBX10
|
T-box 10
|
|
chr11_+_56224436
|
0.429
|
NM_001005213
NM_001013358
|
OR9G1
OR9G9
|
olfactory receptor, family 9, subfamily G, member 1
olfactory receptor, family 9, subfamily G, member 9
|
|
chr17_+_7563763
|
0.419
|
NM_020877
|
DNAH2
|
dynein, axonemal, heavy chain 2
|
|
chr3_-_115826481
|
0.405
|
NM_001164346
|
ZBTB20
|
zinc finger and BTB domain containing 20
|
|
chr20_+_9146036
|
0.405
|
NM_182797
|
PLCB4
|
phospholipase C, beta 4
|
|
chr16_-_21130368
|
0.400
|
NM_003460
|
ZP2
|
zona pellucida glycoprotein 2 (sperm receptor)
|
|
chr14_-_93988838
|
0.392
|
NM_001080451
|
SERPINA11
|
serpin peptidase inhibitor, clade A (alpha-1 antiproteinase, antitrypsin), member 11
|
|
chr22_-_28992787
|
0.392
|
NM_020530
|
OSM
|
oncostatin M
|
|
chr9_+_139265533
|
0.392
|
NM_001004353
|
C9orf173
|
chromosome 9 open reading frame 173
|
|
chr5_+_140154627
|
0.391
|
NM_018905
NM_031495
|
PCDHA2
|
protocadherin alpha 2
|
|
chr5_+_35892747
|
0.385
|
NM_002185
|
IL7R
|
interleukin 7 receptor
|
|
chr9_+_115958051
|
0.385
|
NM_032888
|
COL27A1
|
collagen, type XXVII, alpha 1
|
|
chr22_+_29333069
|
0.380
|
NM_000355
NM_001184726
|
TCN2
|
transcobalamin II
|
|
chr8_+_55691179
|
0.360
|
NM_006269
|
RP1
|
retinitis pigmentosa 1 (autosomal dominant)
|
|
chr11_-_57728228
|
0.350
|
NM_001004459
|
OR1S2
|
olfactory receptor, family 1, subfamily S, member 2
|
|
chr1_+_179148935
|
0.347
|
NM_020950
|
KIAA1614
|
KIAA1614
|
|
chr2_+_121271336
|
0.344
|
NM_005270
|
GLI2
|
GLI family zinc finger 2
|
|
chr11_+_117680504
|
0.332
|
NM_000733
|
CD3E
|
CD3e molecule, epsilon (CD3-TCR complex)
|
|
chr12_+_25096755
|
0.329
|
|
LRMP
|
lymphoid-restricted membrane protein
|
|
chr17_-_39191658
|
0.329
|
NM_025237
|
SOST
|
sclerostin
|
|
chr14_+_94117483
|
0.325
|
NM_000624
|
SERPINA5
|
serpin peptidase inhibitor, clade A (alpha-1 antiproteinase, antitrypsin), member 5
|
|
chr9_-_35860316
|
0.325
|
NM_001004487
|
OR13J1
|
olfactory receptor, family 13, subfamily J, member 1
|
|
chr4_+_71713324
|
0.318
|
NM_031889
|
ENAM
|
enamelin
|
|
chr2_+_48649662
|
0.308
|
NM_172311
|
STON1-GTF2A1L
|
STON1-GTF2A1L readthrough
|
|
chr19_-_14853166
|
0.307
|
NM_030901
|
OR7A17
|
olfactory receptor, family 7, subfamily A, member 17
|
|
chr2_+_158666627
|
0.305
|
NM_173355
|
UPP2
|
uridine phosphorylase 2
|
|
chr1_-_24112345
|
0.304
|
NM_001841
|
CNR2
|
cannabinoid receptor 2 (macrophage)
|
|
chr11_+_110890719
|
0.303
|
NM_001100388
NM_207430
|
C11orf88
|
chromosome 11 open reading frame 88
|
|
chr19_+_15058790
|
0.302
|
NM_001004713
|
OR1I1
|
olfactory receptor, family 1, subfamily I, member 1
|
|
chr2_-_216008689
|
0.299
|
|
FN1
|
fibronectin 1
|
|
chr20_-_43601542
|
0.296
|
NM_080827
|
WFDC6
|
WAP four-disulfide core domain 6
|
|
chr4_-_47831002
|
0.292
|
NM_003328
|
TXK
|
TXK tyrosine kinase
|
|
chr11_-_116199145
|
0.290
|
NM_000482
|
APOA4
|
apolipoprotein A-IV
|
|
chr6_+_72982865
|
0.289
|
NM_001168409
|
RIMS1
|
regulating synaptic membrane exocytosis 1
|
|
chr12_+_50592379
|
0.289
|
NM_001077401
|
ACVRL1
|
activin A receptor type II-like 1
|
|
chr10_-_17211795
|
0.286
|
NM_001081
|
CUBN
|
cubilin (intrinsic factor-cobalamin receptor)
|
|
chr5_+_176806401
|
0.283
|
NM_001174101
NM_030567
|
PRR7
|
proline rich 7 (synaptic)
|
|
chr1_-_149385556
|
0.277
|
NM_001178061
NM_001178062
NM_030913
|
SEMA6C
|
sema domain, transmembrane domain (TM), and cytoplasmic domain, (semaphorin) 6C
|
|
chr20_+_9442995
|
0.271
|
|
C20orf103
|
chromosome 20 open reading frame 103
|
|
chr1_-_155788775
|
0.268
|
NM_001195388
NM_031281
|
FCRL5
|
Fc receptor-like 5
|
|
chr5_+_140160966
|
0.268
|
NM_018906
NM_031497
|
PCDHA3
|
protocadherin alpha 3
|
|
chr14_+_99309688
|
0.263
|
|
EML1
|
echinoderm microtubule associated protein like 1
|
|
chrX_+_138440560
|
0.263
|
NM_000133
|
F9
|
coagulation factor IX
|
|
chr12_+_53901075
|
0.260
|
NM_001005280
|
OR10A7
|
olfactory receptor, family 10, subfamily A, member 7
|
|
chr6_-_169392771
|
0.259
|
|
|
|
|
chr9_-_106329310
|
0.258
|
NM_001001919
|
OR13C4
|
olfactory receptor, family 13, subfamily C, member 4
|
|
chr5_+_150000394
|
0.256
|
NM_001109974
NM_007286
|
SYNPO
|
synaptopodin
|
|
chrX_-_108611940
|
0.255
|
NM_001522
|
GUCY2F
|
guanylate cyclase 2F, retinal
|
|
chr7_+_5609416
|
0.254
|
|
FSCN1
|
fascin homolog 1, actin-bundling protein (Strongylocentrotus purpuratus)
|
|
chr7_-_50596238
|
0.252
|
NM_000790
|
DDC
|
dopa decarboxylase (aromatic L-amino acid decarboxylase)
|
|
chr4_-_100359353
|
0.251
|
NM_000672
NM_001102470
|
ADH6
|
alcohol dehydrogenase 6 (class V)
|
|
chr5_+_357290
|
0.251
|
NM_020731
|
AHRR
|
aryl-hydrocarbon receptor repressor
|
|
chr1_-_36721010
|
0.249
|
|
CSF3R
|
colony stimulating factor 3 receptor (granulocyte)
|
|
chr4_+_17125885
|
0.243
|
NM_001079827
|
CLRN2
|
clarin 2
|
|
chr7_-_50600536
|
0.243
|
NM_001082971
|
DDC
|
dopa decarboxylase (aromatic L-amino acid decarboxylase)
|
|
chr11_+_48194937
|
0.242
|
NM_001005470
|
OR4B1
|
olfactory receptor, family 4, subfamily B, member 1
|
|
chr5_+_127012611
|
0.242
|
NM_001048252
|
CTXN3
|
cortexin 3
|
|
chr11_+_120478584
|
0.241
|
NM_005422
|
TECTA
|
tectorin alpha
|
|
chr3_+_153014550
|
0.240
|
NM_001086
|
AADAC
|
arylacetamide deacetylase (esterase)
|
|
chr4_-_38534802
|
0.239
|
NM_006068
|
TLR6
|
toll-like receptor 6
|
|
chr5_+_72504778
|
0.239
|
NM_153217
|
TMEM174
|
transmembrane protein 174
|
|
chr10_-_60792225
|
0.236
|
NM_001001971
NM_001166698
NM_198215
|
FAM13C
|
family with sequence similarity 13, member C
|
|
chr21_-_42608774
|
0.235
|
NM_003226
|
TFF3
|
trefoil factor 3 (intestinal)
|
|
chr5_+_140181405
|
0.235
|
NM_018908
NM_031501
|
PCDHA5
|
protocadherin alpha 5
|
|
chr15_+_84486245
|
0.234
|
NM_152336
|
AGBL1
|
ATP/GTP binding protein-like 1
|
|
chr19_+_10900502
|
0.233
|
|
C19orf52
|
chromosome 19 open reading frame 52
|
|
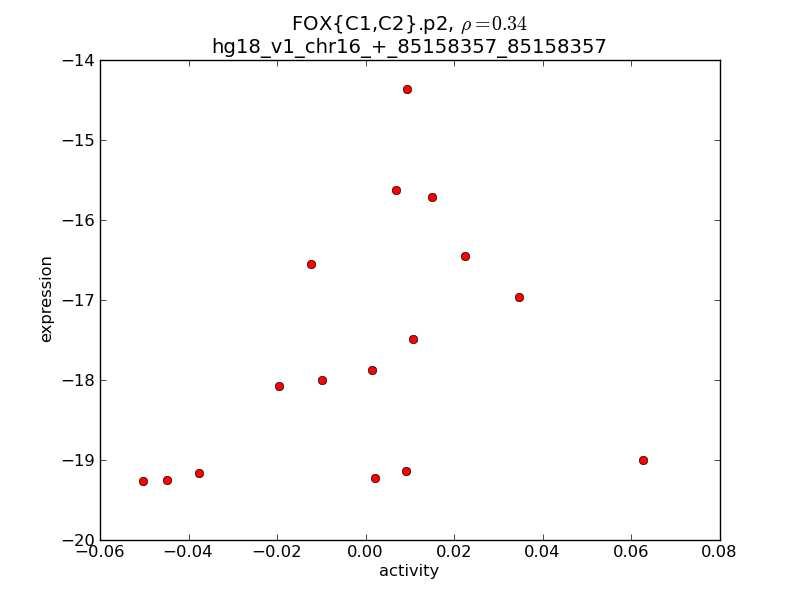
chr16_+_85158357
|
0.231
|
NM_005251
|
FOXC2
|
forkhead box C2 (MFH-1, mesenchyme forkhead 1)
|
|
chr5_+_140146059
|
0.231
|
NM_018900
NM_031410
NM_031411
|
PCDHA1
|
protocadherin alpha 1
|
|
chr15_+_100175888
|
0.230
|
NM_001001674
|
OR4F15
|
olfactory receptor, family 4, subfamily F, member 15
|
|
chr1_-_53972464
|
0.229
|
NM_147193
|
GLIS1
|
GLIS family zinc finger 1
|
|
chr6_+_47732181
|
0.228
|
NM_153839
|
GPR111
|
G protein-coupled receptor 111
|
|
chr5_+_131424245
|
0.222
|
NM_000588
|
IL3
|
interleukin 3 (colony-stimulating factor, multiple)
|
|
chr1_-_56750235
|
0.215
|
|
PPAP2B
|
phosphatidic acid phosphatase type 2B
|
|
chr7_+_73826244
|
0.215
|
NM_000265
|
NCF1
NCF1B
NCF1C
|
neutrophil cytosolic factor 1
neutrophil cytosolic factor 1B pseudogene
neutrophil cytosolic factor 1C pseudogene
|
|
chr4_+_71298187
|
0.214
|
NM_021225
|
PROL1
|
proline rich, lacrimal 1
|
|
chr17_+_7402315
|
0.200
|
NM_001198622
NM_001198623
NM_001198624
NM_003808
NM_172087
NM_172088
|
TNFSF13
|
tumor necrosis factor (ligand) superfamily, member 13
|
|
chr19_-_59309719
|
0.198
|
|
TFPT
|
TCF3 (E2A) fusion partner (in childhood Leukemia)
|
|
chr2_-_49235059
|
0.197
|
NM_000145
NM_181446
|
FSHR
|
follicle stimulating hormone receptor
|
|
chr19_+_47509274
|
0.194
|
NM_173633
|
TMEM145
|
transmembrane protein 145
|
|
chr17_+_3065661
|
0.194
|
NM_014565
|
OR1A1
|
olfactory receptor, family 1, subfamily A, member 1
|
|
chr4_-_68678181
|
0.194
|
NM_207407
|
TMPRSS11F
|
transmembrane protease, serine 11F
|
|
chr21_-_42689192
|
0.192
|
NM_024022
NM_032405
|
TMPRSS3
|
transmembrane protease, serine 3
|
|
chr1_+_150958621
|
0.188
|
NM_001024679
|
C1orf68
|
chromosome 1 open reading frame 68
|
|
chr1_+_64442077
|
0.186
|
NM_152489
|
UBE2U
|
ubiquitin-conjugating enzyme E2U (putative)
|
|
chr20_+_56722188
|
0.185
|
|
|
|
|
chr5_-_156525756
|
0.183
|
NM_130899
|
FAM71B
|
family with sequence similarity 71, member B
|
|
chr19_+_10900419
|
0.183
|
NM_138358
|
C19orf52
|
chromosome 19 open reading frame 52
|
|
chr21_+_42697058
|
0.182
|
NM_001001895
NM_018961
|
UBASH3A
|
ubiquitin associated and SH3 domain containing A
|
|
chr1_-_157772420
|
0.181
|
NM_001004469
|
OR10J5
|
olfactory receptor, family 10, subfamily J, member 5
|
|
chr18_+_41558141
|
0.178
|
|
SLC14A1
|
solute carrier family 14 (urea transporter), member 1 (Kidd blood group)
|
|
chr1_+_158352143
|
0.177
|
NM_000702
|
ATP1A2
|
ATPase, Na+/K+ transporting, alpha 2 polypeptide
|
|
chr1_-_25164061
|
0.177
|
NM_001031680
|
RUNX3
|
runt-related transcription factor 3
|
|
chr4_+_186587537
|
0.176
|
NM_001114357
|
C4orf47
|
chromosome 4 open reading frame 47
|
|
chr1_+_103961476
|
0.176
|
NM_000699
|
AMY2A
|
amylase, alpha 2A (pancreatic)
|
|
chr19_+_43502360
|
0.174
|
|
KCNK6
|
potassium channel, subfamily K, member 6
|
|
chr8_-_124818754
|
0.171
|
NM_001003954
NM_004306
|
ANXA13
|
annexin A13
|
|
chr11_+_60626505
|
0.171
|
NM_014207
|
CD5
|
CD5 molecule
|
|
chr18_-_54447168
|
0.170
|
NM_052947
|
ALPK2
|
alpha-kinase 2
|
|
chrX_-_77801480
|
0.170
|
NM_152694
|
ZCCHC5
|
zinc finger, CCHC domain containing 5
|
|
chr17_-_16816113
|
0.169
|
NM_012452
|
TNFRSF13B
|
tumor necrosis factor receptor superfamily, member 13B
|
|
chr3_-_192531018
|
0.169
|
NM_198152
|
UTS2D
|
urotensin 2 domain containing
|
|
chr4_-_3503951
|
0.168
|
NM_002337
|
LRPAP1
|
low density lipoprotein receptor-related protein associated protein 1
|
|
chr6_-_29163027
|
0.167
|
NM_001005226
|
OR2B3
|
olfactory receptor, family 2, subfamily B, member 3
|
|
chr11_-_5946299
|
0.163
|
NM_001146033
|
OR56A5
|
olfactory receptor, family 56, subfamily A, member 5
|
|
chr17_+_41278035
|
0.163
|
NM_175882
|
IMP5
|
intramembrane protease 5
|
|
chr5_+_156752739
|
0.162
|
|
CYFIP2
|
cytoplasmic FMR1 interacting protein 2
|
|
chr6_-_117256890
|
0.160
|
NM_148963
|
GPRC6A
|
G protein-coupled receptor, family C, group 6, member A
|
|
chr14_+_73884947
|
0.159
|
|
VRTN
|
vertebrae development homolog (pig)
|
|
chr14_-_44046202
|
0.159
|
NM_032135
|
FSCB
|
fibrous sheath CABYR binding protein
|
|
chr4_+_166519392
|
0.159
|
NM_001873
|
CPE
|
carboxypeptidase E
|
|
chr6_+_123142559
|
0.158
|
|
FABP7
|
fatty acid binding protein 7, brain
|
|
chr20_+_42417752
|
0.155
|
NM_001030003
NM_001030004
NM_175914
|
HNF4A
|
hepatocyte nuclear factor 4, alpha
|
|
chr11_+_66547391
|
0.155
|
NM_177963
|
SYT12
|
synaptotagmin XII
|
|
chr3_+_115099007
|
0.155
|
NM_001172105
|
GRAMD1C
|
GRAM domain containing 1C
|
|
chr14_+_94117511
|
0.155
|
|
SERPINA5
|
serpin peptidase inhibitor, clade A (alpha-1 antiproteinase, antitrypsin), member 5
|
|
chr17_+_46176105
|
0.154
|
|
LUC7L3
|
LUC7-like 3 (S. cerevisiae)
|
|
chr7_+_141265085
|
0.154
|
NM_001001656
|
OR9A4
|
olfactory receptor, family 9, subfamily A, member 4
|
|
chr11_-_13474101
|
0.154
|
NM_000315
|
PTH
|
parathyroid hormone
|
|
chr3_+_110024234
|
0.154
|
NM_016388
|
TRAT1
|
T cell receptor associated transmembrane adaptor 1
|
|
chr4_-_3503881
|
0.154
|
|
LRPAP1
|
low density lipoprotein receptor-related protein associated protein 1
|
|
chr16_-_31068329
|
0.154
|
|
PRSS36
|
protease, serine, 36
|
|
chr5_-_160211623
|
0.154
|
NM_025153
|
ATP10B
|
ATPase, class V, type 10B
|
|
chr5_+_140454382
|
0.152
|
NM_018936
|
PCDHB2
|
protocadherin beta 2
|
|
chr15_+_38843535
|
0.151
|
NM_005258
|
GCHFR
|
GTP cyclohydrolase I feedback regulator
|
|
chr1_+_151081953
|
0.149
|
NM_001128600
|
LCE6A
|
late cornified envelope 6A
|
|
chr5_+_54355840
|
0.146
|
NM_002104
|
GZMK
|
granzyme K (granzyme 3; tryptase II)
|
|
chr12_-_49897743
|
0.145
|
|
POU6F1
|
POU class 6 homeobox 1
|
|
chr16_-_70763524
|
0.143
|
NM_031293
|
PMFBP1
|
polyamine modulated factor 1 binding protein 1
|
|
chr10_-_82039158
|
0.143
|
NM_000429
|
MAT1A
|
methionine adenosyltransferase I, alpha
|
|
chr17_-_77233966
|
0.143
|
NM_002602
|
PDE6G
|
phosphodiesterase 6G, cGMP-specific, rod, gamma
|
|
chr7_-_56128098
|
0.141
|
NM_006213
|
PHKG1
|
phosphorylase kinase, gamma 1 (muscle)
|
|
chr21_-_42608531
|
0.141
|
|
TFF3
|
trefoil factor 3 (intestinal)
|
|
chr4_-_118226119
|
0.139
|
NM_152402
|
TRAM1L1
|
translocation associated membrane protein 1-like 1
|
|
chr14_+_87541220
|
0.139
|
NM_003608
|
GPR65
|
G protein-coupled receptor 65
|
|
chr5_+_140777454
|
0.139
|
NM_018927
NM_032101
|
PCDHGB7
|
protocadherin gamma subfamily B, 7
|
|
chr12_+_70618892
|
0.138
|
NM_173353
|
TPH2
|
tryptophan hydroxylase 2
|
|
chr17_-_64649608
|
0.137
|
NM_080284
|
ABCA6
|
ATP-binding cassette, sub-family A (ABC1), member 6
|
|
chr11_-_6418705
|
0.136
|
NM_000613
|
HPX
|
hemopexin
|
|
chr12_+_54231249
|
0.132
|
NM_001005494
|
OR6C4
|
olfactory receptor, family 6, subfamily C, member 4
|
|
chr5_-_88004891
|
0.132
|
|
LOC645323
|
hypothetical LOC645323
|
|
chr6_+_31016755
|
0.131
|
NM_080870
|
DPCR1
|
diffuse panbronchiolitis critical region 1
|
|
chr10_-_99780336
|
0.131
|
|
CRTAC1
|
cartilage acidic protein 1
|
|
chr12_+_8216416
|
0.130
|
NM_001004328
|
ZNF705A
|
zinc finger protein 705A
|
|
chr14_+_23849196
|
0.129
|
NM_001164692
NM_019839
|
LTB4R2
|
leukotriene B4 receptor 2
|
|
chr11_+_113672407
|
0.129
|
|
NNMT
|
nicotinamide N-methyltransferase
|
|
chr10_+_7785347
|
0.126
|
|
ITIH2
|
inter-alpha (globulin) inhibitor H2
|
|
chr8_+_70567634
|
0.125
|
|
SULF1
|
sulfatase 1
|
|
chr8_-_21701616
|
0.122
|
|
GFRA2
|
GDNF family receptor alpha 2
|
|
chr10_+_96688399
|
0.122
|
NM_000771
|
CYP2C9
|
cytochrome P450, family 2, subfamily C, polypeptide 9
|
|
chr17_+_8154864
|
0.122
|
NM_025014
|
ARHGEF15
|
Rho guanine nucleotide exchange factor (GEF) 15
|
|
chr3_-_166397142
|
0.122
|
NM_014926
|
SLITRK3
|
SLIT and NTRK-like family, member 3
|
|
chr14_+_73884918
|
0.119
|
NM_018228
|
VRTN
|
vertebrae development homolog (pig)
|
|
chr3_-_42892195
|
0.119
|
|
CYP8B1
|
cytochrome P450, family 8, subfamily B, polypeptide 1
|
|
chr4_+_88973144
|
0.119
|
NM_001184695
NM_001184696
NM_001184697
NM_020203
|
MEPE
|
matrix extracellular phosphoglycoprotein
|
|
chr10_+_7785360
|
0.118
|
|
ITIH2
|
inter-alpha (globulin) inhibitor H2
|
|
chr21_-_37366684
|
0.118
|
NM_153681
|
PIGP
|
phosphatidylinositol glycan anchor biosynthesis, class P
|
|
chr8_-_95298706
|
0.117
|
NM_001144663
|
CDH17
|
cadherin 17, LI cadherin (liver-intestine)
|
|
chr4_+_120276386
|
0.117
|
NM_016599
|
MYOZ2
|
myozenin 2
|
|
chr5_-_22248630
|
0.117
|
|
CDH12
|
cadherin 12, type 2 (N-cadherin 2)
|
|
chr19_+_14913298
|
0.117
|
NM_012377
|
OR7C2
|
olfactory receptor, family 7, subfamily C, member 2
|
|
chr17_+_37967617
|
0.117
|
NM_001042529
NM_001042530
NM_001042531
NM_001042532
NM_025233
|
COASY
|
CoA synthase
|
|
chr2_+_137464931
|
0.114
|
NM_001080427
|
THSD7B
|
thrombospondin, type I, domain containing 7B
|
|
chr17_+_76988134
|
0.114
|
NM_001080519
|
BAHCC1
|
BAH domain and coiled-coil containing 1
|
|
chr1_+_85300580
|
0.113
|
NM_145172
|
WDR63
|
WD repeat domain 63
|
|
chr8_+_54955962
|
0.113
|
NM_003702
|
RGS20
|
regulator of G-protein signaling 20
|
|
chr17_-_36347197
|
0.113
|
NM_015515
|
KRT23
|
keratin 23 (histone deacetylase inducible)
|
|
chr7_-_55897938
|
0.112
|
NM_207366
|
SEPT14
|
septin 14
|
|
chr11_+_113672378
|
0.111
|
|
NNMT
|
nicotinamide N-methyltransferase
|
|
chr5_+_79366746
|
0.109
|
NM_003248
|
THBS4
|
thrombospondin 4
|
|
chr3_-_117647053
|
0.109
|
NM_002338
|
LSAMP
|
limbic system-associated membrane protein
|
|
chr10_+_7785290
|
0.109
|
|
ITIH2
|
inter-alpha (globulin) inhibitor H2
|
|
chr8_-_23619866
|
0.108
|
NM_001136271
|
NKX2-6
|
NK2 transcription factor related, locus 6 (Drosophila)
|
|
chr12_+_6424293
|
0.108
|
NM_001242
|
CD27
|
CD27 molecule
|
|
chr1_-_68688219
|
0.107
|
NM_000329
|
RPE65
|
retinal pigment epithelium-specific protein 65kDa
|
|
chr18_+_50409387
|
0.107
|
NM_173629
|
C18orf26
|
chromosome 18 open reading frame 26
|
|
chr8_-_27171814
|
0.106
|
NM_030795
|
STMN4
|
stathmin-like 4
|
|
chr1_+_245818284
|
0.106
|
NM_001001915
|
OR2G2
|
olfactory receptor, family 2, subfamily G, member 2
|
|
chr11_+_93940121
|
0.106
|
NM_152431
|
PIWIL4
|
piwi-like 4 (Drosophila)
|
|
chr2_+_69055208
|
0.105
|
NM_019617
|
GKN1
|
gastrokine 1
|
|
chr14_+_19414230
|
0.104
|
NM_001005501
|
OR4K2
|
olfactory receptor, family 4, subfamily K, member 2
|
|
chr4_+_74491272
|
0.103
|
|
ALB
|
albumin
|
|
chr12_+_25096472
|
0.102
|
NM_006152
|
LRMP
|
lymphoid-restricted membrane protein
|
|
chr6_-_41230003
|
0.101
|
NM_178174
|
TREML1
|
triggering receptor expressed on myeloid cells-like 1
|
|
chr12_+_115455579
|
0.100
|
|
NCRNA00173
|
non-protein coding RNA 173
|
|
chr19_+_6981593
|
0.100
|
NM_001136507
|
MBD3L5
|
methyl-CpG-binding domain protein 3-like 5-like
|